Statistics and the Infographic
Each discussion automatically tracks and collates certain information about the discussion. To see this information, open the Discussion Menu and select ‘Info / Stats / Topology’ (the ‘Info / Stats / Topology’ window also appears automatically the first time you visit a discussion). For quick access to this window, click the debate topology icon located on the top left of the screen in a debate.
At the top of the window, the title and cover image of the discussion will appear (see: Adding Tags and Images). Underneath, you can view statistics for the discussion: the number of claims, number of contributions, number of votes, number of participants, and the number of views the discussion has had.
Next, you’ll find the discussion background information if it has been added (see: Adding Background Info), which may include an introduction, or key information necessary to the discussion.
The next item is a sunburst graphical representation of all content in the discussion – the infographic or topology.
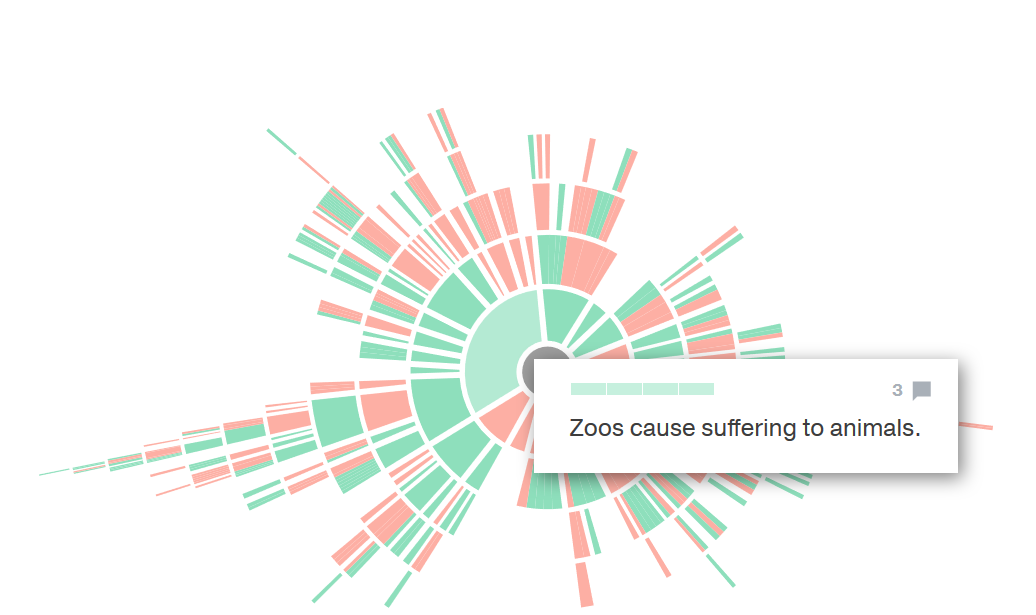
Hovering over any bar in the infographic will show you the text of the relevant claim. Clicking on a bar will take you to that claim’s location.
Below this, you’ll be able to see any tags the discussion currently has (see: Adding Tags and Images). These will give you a brief idea of what subjects may be covered in the discussion.
The final item is a list of participants, sorted by the number of claims created, then the number of actions, and finally the number of votes within the discussion.
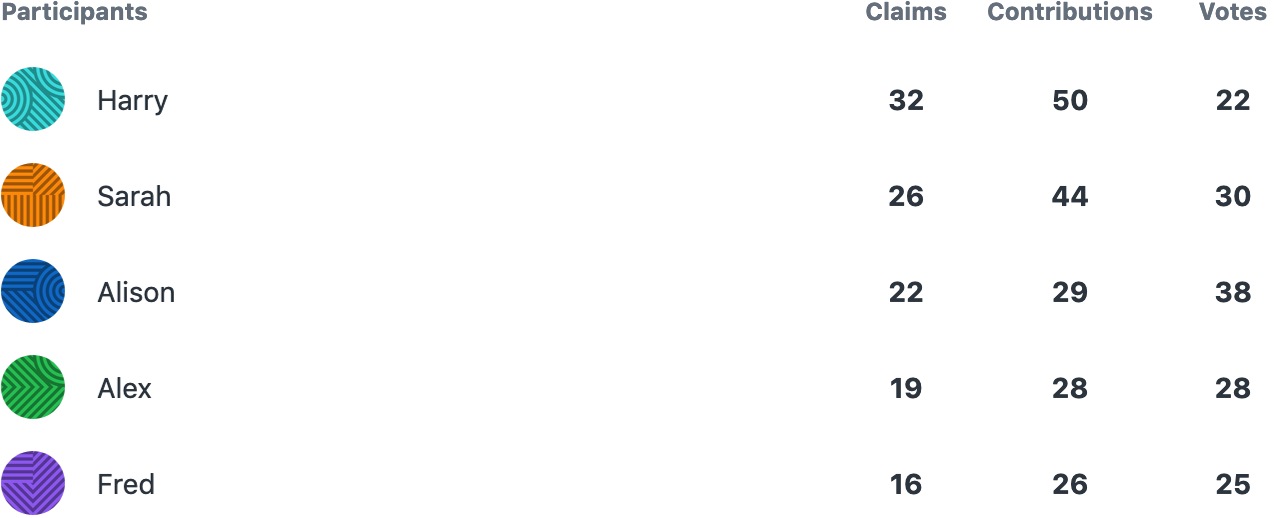
If you are not within the top ten participants, your stats will be shown at the bottom of the list. Select ‘Show More’ to see all contributors in the discussion. Clicking on the number of claims or actions for someone allows you to search for their claims or comments within the discussion.